Simple simulation of a substrate
Overview of pyPENELOPE
The desktop of pyPENELOPE contains 4 areas:
- Menu bar
- Tool bar
- Tree of simulations
- Results viewer
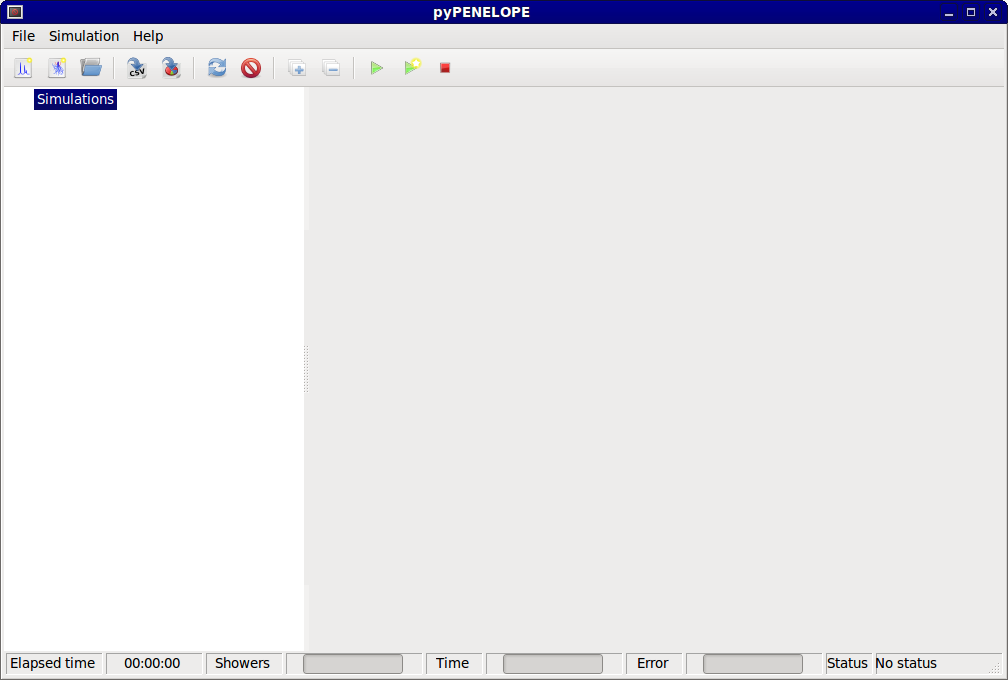
pyPENELOPE’s desktop
Creating a new simulation
Two types of simulation can be currently created in pyPENELOPE:
- a simulation that records X-rays and electrons distributions, i.e. the main program PENEPMA
- a simulation of only a couple electron trajectories
In this tutorial, we will focus on the first type of simulation. To run a electron trajectories simulation, please refer to the Simulate an electron shower tutorial.
Click on  icon in the tool bar.
A wizard will appear.
The wizard is used to setup all the parameters of a simulation.
icon in the tool bar.
A wizard will appear.
The wizard is used to setup all the parameters of a simulation.
In the first page, you must specify a name for the simulation and an empty directory where to save the simulation input files. The results files will also appear in this directory. Please note that the directory has to be empty to prevent any files to be overwritten.
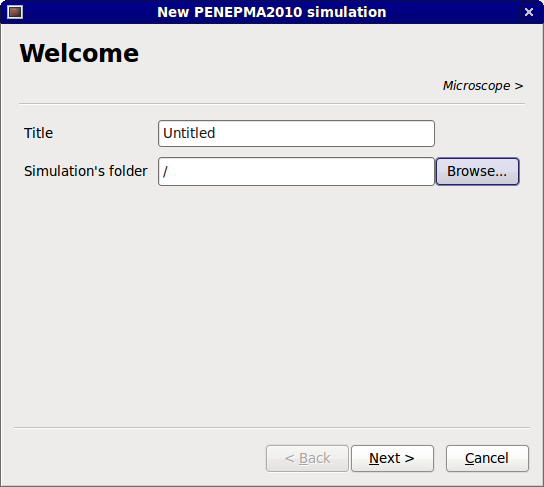
PENEPMA wizard
Microscope parameters
The incident energy is the energy of the incident electrons. The beam is coming vertically down on the sample. The direction of the beam is (0,0,-1), parallel to the z-axis and pointing towards the negative z’s.
The spatial distribution of the beam is assumed to be gaussian. The beam diameter is defined as being equal to one standard deviation. In other words, 68% of the electrons are at one standard deviation from the center of the beam.
The tilt parameter is the inclinaison angle of the sample. The sample tilts along the x-axis. The rotation specifies the rotation of the sample around the z-axis. The beam position specifies the center of the beam. Moving the beam could be useful to simulate beam interaction with complex geometries such as next to a grain boundary (vertical interfaces).
Finally, the take-off angle is the angle of the EDS/WDS detector. This angle is used to automatically generated a set of detectors, centered about this angle. The take-off angle is defined as the elevation angle from the surface sample to the detector.
Geometry and materials
The setup of the geometry is closely linked to the definition of the different materials in the sample. In the case of the simulation of a substrate, only one material must be defined. However, the definition of materials is always the same, regardless on how many materials have to be defined.
To select the material of the substrate, click on Select. The material dialog will appear.
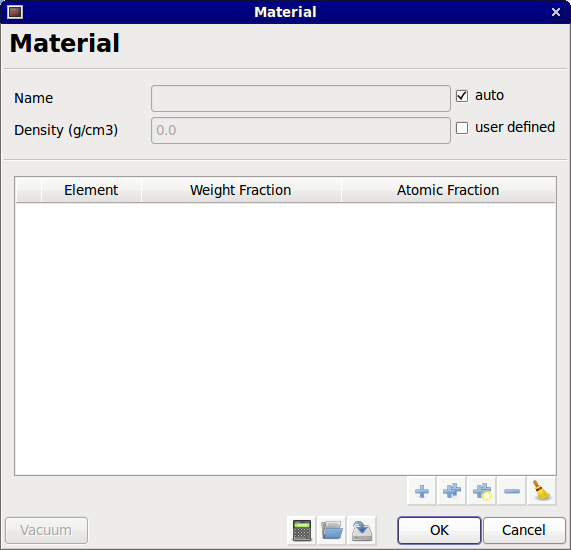
Material dialog
A material is defined by a set of elements, a density and a name. The first step is to add elements to the material. Three options are available:
Select one element from the periodic table
Add several elements by typing a list of them
Add several elements from a chemical formula
Let’s start with the first option.
By clicking on , the periodic table of elements is shown.
Apart from selecting an element, this dialog shows the density, atomic mass
and all the x-ray transitions (energy and probability) for that element.
After the selection, the element is added in the element list.
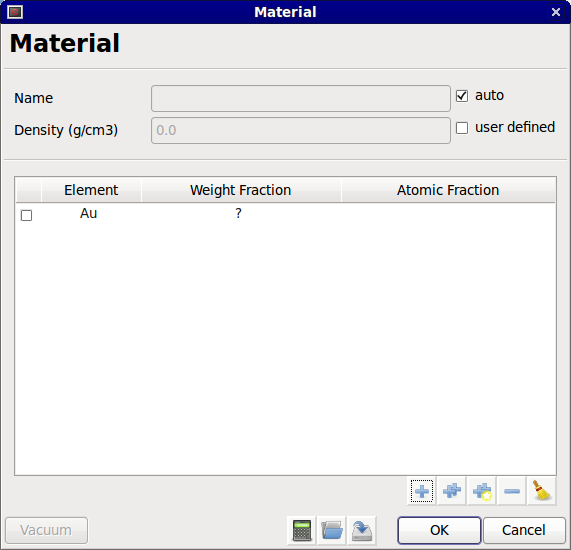
New element
A question mark (?) appears in the weight fraction column. If the weight fraction of that element is known, it can be entered by clicking on the question mark and entering the weight fraction. The weight fraction must be a value between 0.0 and 1.0 and the total weight fraction of the material must be equal to 1.0, no exception. Note that only the weight fraction can be modified. The atomic fraction column is only used to display the equivalent atomic fractions for the specified weight fractions. If the user wants to enter a material using atomic fractions, we suggest using the third option to add elements (i.e., from a chemical formula).
If the weight fraction of an element is unknown, the question mark can be left
in the weight fraction column.
Based on the other weight fractions, pyPENELOPE will automatically calculate
the remaining weight fraction and replace the question mark by this value.
If more than one question marks is used, the remaining weight fraction is
split equally.
This calculation is performed when the dialog is closed, or by clicking on the
calculation  button.
This button can also be used to refresh the atomic fractions and calculate
the density.
button.
This button can also be used to refresh the atomic fractions and calculate
the density.
The density is automatically calculated based on the weighted average of the element’s density:

where  is the weight fraction of element i.
This method is not very accurate since compounds may have a very specific
density.
The user can therefore override this density and enters one manually.
Simplify check the user defined check box.
is the weight fraction of element i.
This method is not very accurate since compounds may have a very specific
density.
The user can therefore override this density and enters one manually.
Simplify check the user defined check box.
The name of the material is automatically set as an approximated chemical formula based on the atomic fraction. It can also be customized by unchecking the auto check box.
Other options of the material dialog are to save or load previously saved material. A material is saved as an XML file.
Simulation parameters
These parameters define the absorption energies, elastic scattering parameters and cutoff energies for a simulation. The default simulation parameters are usually applicable to most simulations, for instance to obtain a full X-ray spectrum. The following paragraphs give a small description of the parameters.
The absorption energies are the energies at which the simulation of electrons or photons is halted. There is a significant gain of simulation speed if the absorption energies are increased. For example, if the user is only interested in the intensity of a specific X-ray line, the absorption energies can be set right below the energy of this X-ray line. A fine tuning procedure is available for this specific application in the last panel of the wizard. Click the “Use default simulation parameters” to activate it.
The elastic scattering parameters, C1 and C2, define the allowable deflection angle of soft collisions between two consecutive hard collisions. Both parameters can take values between 0.0 and 0.2, inclusively. In X-ray microanalysis, only C1 may have an effect on the simulation as C2 only affects electron trajectories above 1 MeV. It is however a good practice to keep C1 and C2 equal.
A high deflection angle (large C1 and C2) results in a less detailed simulation of electron trajectories, therefore increasing the computation speed. High deflection angle can however change the electron distribution. Several simulations were performed to study the effect of C1 on different materials and geometries. We observe no significant change in accuracy by using C1=C2=0.2, but a significant gain in efficiency (simulation speed). For more information these simulations please refer to the Optimization of PENEPMA parameters page.
The inelastic collisions (WCC) and Bremsstrahlung emission (WCR) cutoff energy loss influence the simulated energy distributions.
Todo
finish explanation of WCC and WCR
Interaction forcings
Some interactions have a low probability, for instance in the case of electron-photon interaction, inner-shell impact ionisation and hard bremsstrahlung emission. To increase probability, the variance reduction technique, interaction forcing, can be used. It reduces the mean free path between hard interactions which leads to an increase in photon generation. In other words, more photons can be detected. However, to keep the simulation unbiased, each generated photon is assigned a small “weight” than the incident electron. If this photon is collected by one of the detectors, the intensity is increased by the weight of this photon. Over-increasing the probability of an interaction can however reduce the speed of a simulation if the generated photons are not detected as the simulation must compute the trajectories and interactions of all these photons.
As part of the optimization study of the parameters of PENEPMA, the default interaction forcings parameters were established to improve the efficiency of a large range of simulations. It is however possible that for a specific geometry or composition, more optimal interaction forcings could be found.
Photon detectors
Photon detectors collect the emitted photons to produce energy spectra and intensity tables. They are ideal detectors (no windows, no collection efficiency, etc.). pyPENELOPE offer 3 types of detectors:
- hemispheric (
sr)
- annular
- delimited
In actual EDS or WDS measurements, X-ray detectors cover a very small solid angle. They would correspond in pyPENELOPE to a small delimited detectors. However, simulations with such detectors would be very inefficient as most of the simulated photons are never collected. For homogeneous samples, annular detectors are therefore more useful as they cover a much larger solid angle. As such, the default photon detectors in pyPENELOPE are annular detectors centered around the take-off angle specified in the Microscope panel. The angular opening of these detectors are varied between 2 to 20 degrees. The large opening detector will collect more photon and will have a better statistics whereas the small opening one will be more representative to the experimental measurements, especially if absorption is important.
Apart from the default detectors, users can define specific ones for their applications. Up to 50 detectors can be defined. The number of detectors does not influence significantly the speed of the simulation.
Distributions
Apart from the X-ray intensities and spectra, three other distributions are recorded during a simulation:
- energy distribution of electrons and photons
- angular distribution of electrons and photons
The energy distributions give the distribution of all electrons and photons exiting the sample. They are separated by transmitted (exiting below the sample) and by backscattered (exiting above the sample).
Warning
For old PENEPMA users, the definition of these distributions were updated to reflect the nomenclature typically used in microanalysis.
Todo
write information about angular distributions
The default parameters are usually applicable to all types of simulations.
Limits
A PENEPMA simulation can be halted based on three different conditions:
- after a certain number of showers are simulated
- after a certain time
- when the uncertainty on a X-ray line is below a certain value
Note that these conditions are optional. If they are all deactivated, the simulation will continue until the user stops it.
For comparison purposes (e.g. calculating a k-ratio), the last condition (uncertainty on a X-ray line) is probably the most useful. First, the user must select a X-ray line of interest. The combo box menu lists all the X-ray transitions for the elements in the defined materials. Next, the user must enter the relative uncertainty limit on the total intensity detected as a percentage. For example, if the user enters 5%, the simulation will automatically stop when the relative uncertainty on the total intensity of the selected X-ray line is below 5%. Another limit can be set to only consider the fluorescence contribution to the total intensity. For instance, if only the fluorescence is of interest, the uncertainty limit on the total intensity can be set to 0.0 and the one on the fluorescence to 1%.
Finally, one must select the detector from which the total intensity and/or the fluorescence intensity will be evaluated from. The combo box gives a list of all the defined detectors and two other options. The first one (“any detector”) will stop the simulation when the uncertainty of any detector is below the set limit. This will most likely correspond to the largest defined detector. The second option (“all detectors”) is the inverse of the first option: the simulation will stop when the uncertainty of all detectors is below the set limit.
Fine tuning
The last panel offers fine-tuning options to adjust several parameters together. It also provides some final check in case some parameters were not set properly. The first option ensures that the energy limit of any parameter is below the one of the beam energy. For instance, if the option is selected, the upper energy limit of the photon detectors is automatically set to be equal to the beam energy. It is recommended to always have this option checked.
The second option is only available if the uncertainty limit condition is selected. As discussed previously, to speed up a simulation, the absorption energy of electrons and photons can be set right below the energy of the X-ray line of interest. This option is to automatically perform this task based on the selected transition of the uncertainty limit. For example, if the Cu Ka1 (8.047 keV) is selected, the absorption energies are set to 7.947 keV if this option is selected. The same goes for the lower limit of the energy distribution and the photon spectra.
Running a simulation
After clicking Finish, the new simulation will appear in the simulations tree in the main desktop window.
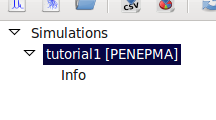
New simulation.
By clicking on the info item, all the parameters defined in the wizard can be
reviewed.
To start the simulation, click on  button from the toolbar.
All the simulation input files will be automatically created (you can take a look in the simulation folder) and then the simulation will start. The progress of the simulation is displayed in the status bar. It is refreshed approximately every 1-2 minutes.
It is also possible to see preliminary results of a simulation by clicking on
 button.
The simulation and all the results (if present) will be reloaded.
button.
The simulation and all the results (if present) will be reloaded.
You can stop the simulation at any time by clicking on  button.
The stop button can also serve to pause the simulation.
However, all the computations since the last progress update will be lost.
To resume the simulation, click on the button again.
To restart the simulation from the beginning, click on the  button.
The inputs and results files will be deleted and a new simulation will start.
button.
The inputs and results files will be deleted and a new simulation will start.